I've just finished adding a 1960 chart of the harbour to Gwulo (show me) <= Click the "show me" to show the chart overlaid on the modern map above.
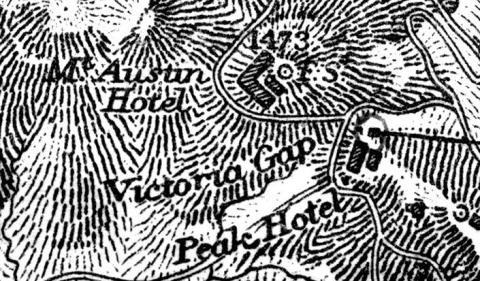
At first glance it is a curious muddle of contradictory features. eg when I look at The Peak, the L-shaped Mount Austin Hotel is clearly marked, overlooking the upper terminus of the Peak Tram, and the Peak Hotel (show me).
The hotel was sold to the government in 1897 and converted into a Barracks for the army, so that must mean the chart was drawn before the 1900s. But ...
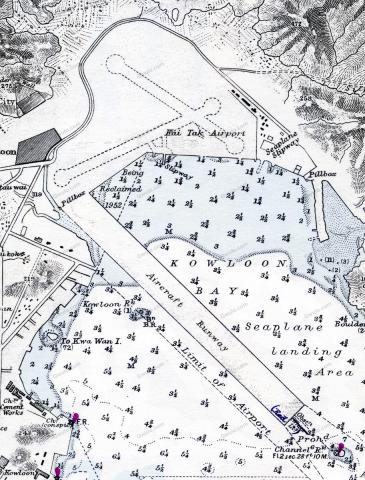
... look across the harbour to Kowloon, and Kai Tak's runway is clear to see (show me).
That should mean the chart was drawn in the 1950s or later. How can we make sense of two such different dates for the same chart?
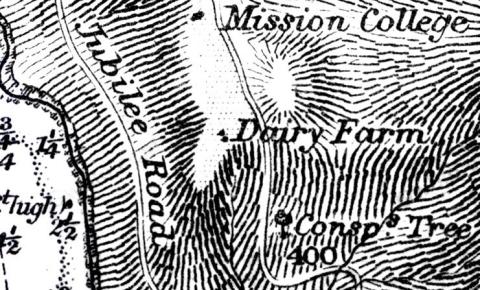
The choice of items marked on the chart, and the way they're described, are also unusual. There are three examples of this near to Aberdeen on Hong Kong Island. First, just south of the Dairy Farm in Pokfulam there's a single tree drawn on the hillside, marked "Conspicuous Tree" (show me).
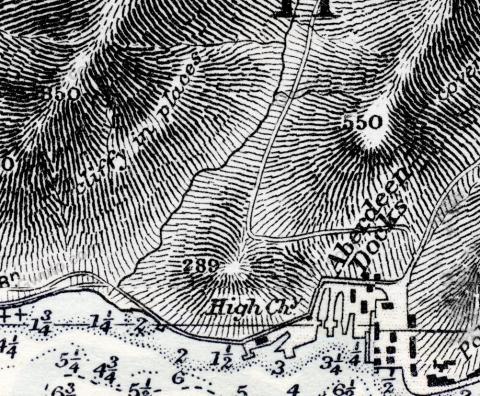
Next there's a "High Chimney" marked next to the Aberdeen Docks (show me), and the hills overlooking the docks are marked "cliffy in places"! (show me).
A logo in the top-right corner of the chart helps explain what's going on (show me).
This chart was produced by the UK's Hydrographic Office, the organisation responsible for producing charts to help sailors answer two important questions:
- Is my ship about to hit anything?
- Where am I? (See #1)
Inland features like the buildings on the Peak or road layouts don't help answer those questions, so there isn't any need for great accuracy there. Instead the chart must show all shallow water, rocks, and coastlines, including any recent changes like the new Kai Tak runway.
Some inland features are useful though, if they can help the sailor establish their location. That's why obvious landmarks such as high chimneys, conspicuous trees, and even "cliffy" hillsides, are marked.
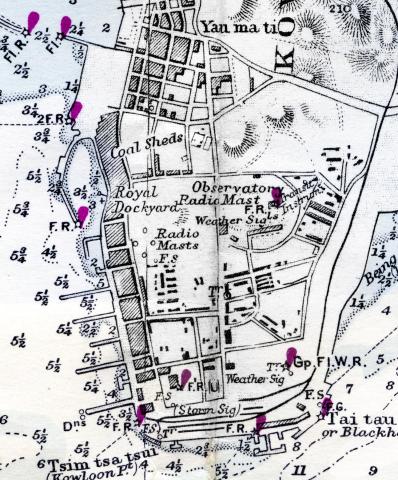
Those landmarks aren't any use after sunset, so the chart also has purple marks added, showing where the lights around the harbour are located. A set of standard initials describe each light's appearance, eg "F.R." for "Fixed Red", or "Fl." for "Flashing" (show me).
South of Hong Kong Island, I also noticed these three pairs of beacons marked on the chart:
- (A) Bluff Point, south of Stanley (show me)
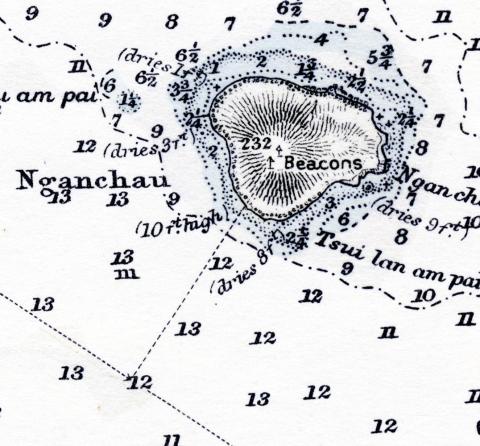
- (B) Ngan Chau, off Chung Hom Bay (show me)
- (C) Magazine Island and the road to Aberdeen (show me)
The beacons' job was to give sailors a measured distance they could use to accurately calculate their ship's speed. The ship would sail along the imaginary line between a white painted mark on Po Toi island and the summit of Castle Peak, while a sailor with a stopwatch kept an eye on those beacons. At the moment they saw the two beacons at (A) were in line with each other, they started their stopwatch, then when the two beacons at (B) were in line they'd stop. The distance between those two points was known to be two miles, enabling the sailors to calculate the ship's speed. If they needed longer distances, (B) and (C) were three miles apart, or (A) and (C) were five miles apart. Here are the beacons at (B).
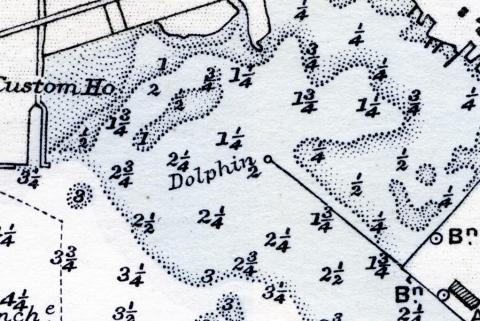
I was also surprised to see a dolphin marked off Sham Shui Po (show me).
Alas, not one of Hong Kong's fast-disappearing pink dolphins:
It must be a while since Hong Kong's harbour around Sham Shui Po was clean and quiet enough for the pink dolphins to visit. Instead, as Wikipedia explains:
A dolphin is a man-made marine structure that extends above the water level and is not connected to shore. Typical uses include extending a berth (a berthing dolphin) or providing a mooring point (a mooring dolphin).
Here's a view of that area from the 1930s, that shows the line extending from the seawall, with the dolphin at the end:
In summary, take any of the inland sections of this chart with large pinch of salt, and concentrate on the sea and the shoreline instead. I hope readers interested in the harbour's history will find lots to explore, and let us know of any new discoveries in the comments below.
Thank you:
A big thank you to Dennis Quong who donated this paper chart to me. It originally belonged to his father.
Further reading:
- If you haven't used Gwulo's maps before, I recommend watching this short tutorial to get the most out of them.
- Explore these maps on Gwulo from 1845, 1896, 1945, and 1956.
- Several of the lights around Hong Kong's harbour have been documented on the map of Navigational Beacons. You are welcome to add more, just add a Place for each beacon and give it the tag Navigational beacon.
- Read more about the Measured Mile Beacons south of Hong Kong
- Explanations for F., Fl., and other common abbreviations for harbour lights (see section K on page 299)
Corrections:
- In the comments below, Stephen pointed out this is a chart, not a map as I originally wrote. I've updated the text.

Comments
1960 chart
Chart or nautical chart please, not 'map'.
Much the most important thing to grasp when looking at charts is that by and large the terrestrial detail wasn't all that important and so generally didn't necessarily get kept up to date. Indeed if you look at the Hydrographer's seal that you show, you will see something significant. It is that the seal CONTINUED to have the initials of Francis Beaufort, the hydrographer 1829-1854. That's because (look down to the bottom line below the neat line in the middle) this chart is based on the same 'copper' (i.e. engraved copper plate) that was used to create the first ever detailed nautical chart of HK Island waters, that of Sir Edward Belcher and the officers and men of HMS Sulphur in 1841, published by the UKHO in 1843. If you look to the right corner of the bottom, near the chart number (1466), you will see it says "Engraved 1843". It was UKHO practice - not always adhered to - to retain the initials of the Hydrographer at the time of first publication, hence the 'FB' on the seal of a chart published in 1959 (see below).
It follows that in the subsequent years navigationally important stuff like changing coastlines, depths and aids to navigation (lights and buoys) get pretty swiftly and precisely updated, but other stuff not so. Andrew Cook, the preeminent scholar in these matters, has identified over 65 issues (i.e. different versions) of 1466 and believes that may even be only 50% or so of the actual number of variants - pretty impressive for c.120 years and a testament to the regularity and quantum of changes a growing HK underwent; a new variant about every two years. So, it would be only potentially navigationally significant topographical and built environment changes that would have been likely to get changed on a chart, and then when and only when there was a new edition (this one, editionwise, is 1923) or a Large Correction (this one, 1953).
The key bit of info in the colophon (the title) is that the last comprehensive survey data was in 1949, based on work by what is (wrongly by that date) called the Harbour Department - it had become the Marine Department in 1947. The last actual new edition, as noted, had been in 1923 (back to the bottom below the neat line) with only what are called 'large corrections' - i.e. sufficiently large amounts of new data to require a significant area of the copper plate to be changed - up to, again as noted, 1953. Over at the bottom left corner below the neat line you'll see that the last 'small correction' was in Notice to Mariners No. 1139 of 1959, which because it is printed, means it was added to the plate before the chart was printed.
Equally important, therefore, is that this shows there is NO data on the chart later than 1959 (and probably, in practice 1958 - data took time to get through the system), since there is no later, hand-entered small correction for a date after 1959. So not 1960, but 1959.
It is probable that all the names on the chart are the names you will find on a new (i.e. uncorrected) version of the 1923 edition or even an earlier edition (there were ones in 1892 and again in 1893, and one of those would have been when the Mt Austin Hotel made its appearance). The same would be true of rather a lot of the other terrestrial data.
So it isn't really that there are 'contradictory features', more that the general mish-mash is typical of a chart that isn't much interested in what the lubbers are getting up to unless whatever that is has navigational significance. That the Mt Austin Hotel is labelled merely means that its change of function in 1897 wasn't navigationally important (the conspic buildings, which did have a navigational value, were what remained). By 1959 there had been so much new building and so on since 1923 that, since the chart was probably marked for discontinuation (see comment on metrication, etc. below), no one was going to bother incurring the significant costs of wholesale change. What would have been needed was an entirely new chart and thinking, see below, was almost certainly along the lines of rationalizing this chart out of existence because for the 1960s-70s it was to a navigationally otiose scale.
1466 chart stayed in production through until the late 1960s or possibly early '70s. The last large correction was in 1966 and my recollection is that there may have been subsequent small corrections through until c.1972, the chart's number being reallocated to a chart of Ibiza, Spain in 1974. Wholesale change to BA chart appearance, metrication and HK's galloping reclamation are what did for 1466: Hong Kong. It was replaced by a different set of charts entirely. Cutting out this sort of medium scale chart encompassing all of HK was part of a major rationalization of the chart coverage of HK that carried on through pretty much until the HKHO took over responsibility for HK charting in 1995.
Best,
StephenD
re: 1960 chart
Thanks for the correction, I've updated the text to read 'chart'.
1960 is the right year. The 'Small corrections' at bottom left continues to a second line, with one more change from 1959, then two from 1960.
I enjoyed learning more about the history of these charts, and the significance of the 'FB' initials. Thanks very much for sharing your knowledge with us.
Best regards, David
1960 chart
Whoops - sorry. Stupid. Tricky to move around the chart with Lamma Island's internet speed, so I didn't get to the extra small correction. 1960 let it be.
As a bit of useless knowledge that's rather fun, the French for a 'dolphin' is, somewhat oddly, 'un duc d'albe', said to be named after the 3rd Duke of Alba (Fernando Álvarez de Toledo y Pimentel (1507-1582)), who is supposed to have moored ships to piles driven into the river bed during his thumping of the Portuguese in 1580, though since he invaded overland quite why the dolphins were needed is obscure. The Germans, who refer to the thingies as Dalbe, Dalle, Dalben, Dälben, or Duck-, Duk-, or Dückdalben (the Friesians delightfully call them Dickdolle) claim, rather more plausibly, that the origin was the authoritarian Duke's use of them during his ruthless attempts to suppress rebellion in the Spanish Netherlands 1567-1573.
It's probable (no one actually knows) that the English 'dolphin' is a typical monoglot Brit's mangled attempt to say the German abbreviated form, 'Dalben', especially the umlauted variant pronounced 'dellben'.
StephenD
Lei U Mun Beacon
Interestingly, this chart marks the Lei U Mun Beacon, which today is the No. 5 light located on a submerged shoal off Yau Tong. Also, the characteristics of the fixed red lights of the beacons marking the prohibited anchorage areas are shown, which is incommon today. These underwater cable beacons are now marked on charts with a dedicated symbol and if lit are assumed to be fixed red. Pier end lights are rarely marked on local charts, as they are required by law and most certainly show a fixed red light.